Best MBBR System for Wastewater Treatment in 2026
Choosing the Best MBBR System for Wastewater Treatment in 2026 starts with the wastewater, not the equipment brochure. Flow variation, temperature, influent strength, and discharge limits all shape the design. A compact reactor may fit a crowded plant, yet still struggle if its media movement or aeration is poorly matched to the load. Small details matter.
MBBR pioneer Hallvard Ødegaard’s published work has helped establish the process’s technical foundations. A careful paraphrase of his central MBBR insight is: “Biofilm carriers provide protected surface area for treatment while moving within the reactor.” This is a paraphrase, not a verified verbatim quotation. It captures a useful design principle, but not a guarantee of performance. Carrier fill fraction, screen design, oxygen transfer, and operating control still need careful review.
This guide compares systems through practical questions: What treatment duty must the plant meet? Can the media circulate evenly in the actual tank geometry? Are blowers, screens, and replacement parts accessible? Operators should also check vendor data against pilot results or comparable installations. Ask for the operating conditions behind every performance claim. Look closely at cold-weather results.
There is no universal winner. A system that performs well at one site may disappoint at another. That is worth admitting. The sections ahead assess process fit, design choices, lifecycle costs, and commissioning needs, so readers can identify an MBBR solution suited to their plant—not merely the most impressive specification sheet.
What Is an MBBR System and How Does It Treat Wastewater?
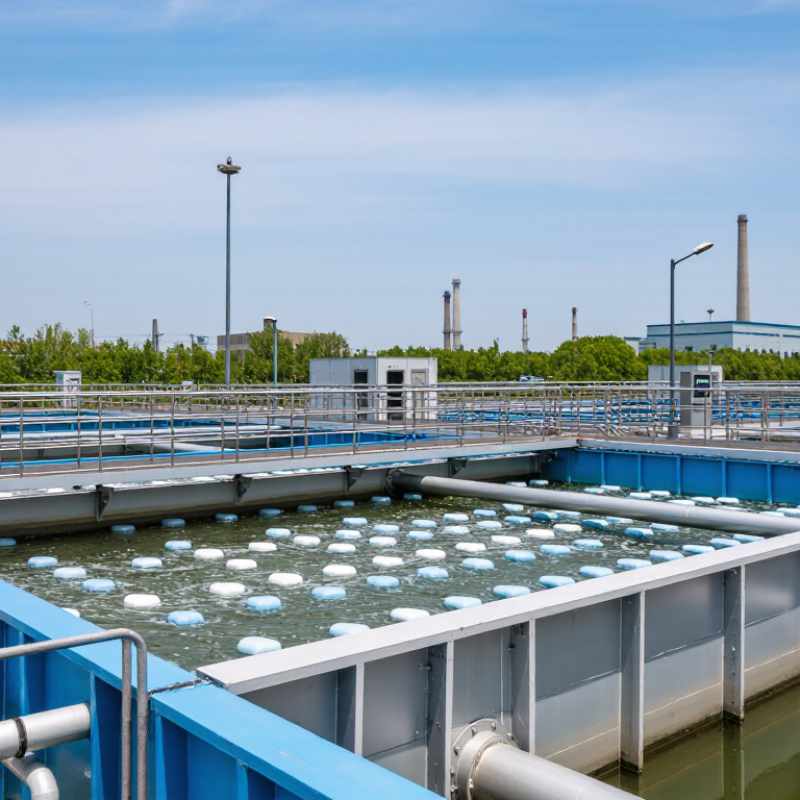
An MBBR, or moving bed biofilm reactor, treats wastewater by growing microorganisms on small plastic carriers inside a tank. The carriers move with the water and mixing air, while screens keep them inside the reactor. Wastewater passes across the biofilm-coated surfaces. Microbes consume biodegradable pollutants; with suitable oxygen and conditions, other microbes convert ammonia into nitrate. The process depends on both attached growth and good contact between wastewater and biofilm. That is the core idea.
For ammonia removal, oxygen and alkalinity matter. The US EPA’s Municipal Nutrient Removal Technologies Reference Document (2008) gives stoichiometric requirements of about 4.57 grams of oxygen and 7.14 grams of alkalinity, as calcium carbonate, per gram of ammonia-nitrogen oxidized. These figures help explain why aeration and water chemistry need careful monitoring. MBBR tanks are often followed by clarification or another solids-separation step, because biofilm can detach and leave the reactor. Operators should track dissolved oxygen, ammonia, and carrier movement. Design calculations can look tidy; actual wastewater varies, and temperature swings or changing loads can upset performance.
Core Components and Treatment Stages of an MBBR System
Best MBBR System for Wastewater Treatment in 2026
An MBBR system turns a tank into a working biofilm habitat. Screened wastewater enters the reactor, where plastic carriers move through aerated or mixed water. Microorganisms grow on the carriers and break down organic matter; additional zones can support nutrient removal. A retention screen keeps carriers inside the tank, while a downstream clarifier or filter separates suspended solids. Small details matter.
The reactor is only one part of the treatment train. In a 2006 review in Water Science & Technology, wastewater researcher Hallvard Ødegaard describes MBBR as a compact biofilm process suited to new plants and upgrades. The U.S. EPA’s 2022 Clean Watersheds Needs Survey estimated $630.1 billion in wastewater and stormwater infrastructure needs nationwide. That figure signals broad investment pressure, not a predicted MBBR market or project cost. Actual performance depends on influent strength, temperature, oxygen transfer, carrier movement, and solids handling. More media is not automatically better; that assumption deserves checking.
Tips: Confirm screen openings match the carrier dimensions, and inspect the screen during commissioning. Set aeration and media loading using design calculations and site-specific testing. Keep access clear around blowers and screens. It sounds obvious, but maintenance access is often underestimated. Monitor dissolved oxygen, ammonia, and suspended solids to catch process changes early.
Key Criteria for Choosing an MBBR System in 2026
An MBBR system should be selected against measured wastewater flows, not only a brochure’s peak capacity. Review average and peak daily flow, BOD or COD, ammonia, temperature, and seasonal changes. A plant receiving sharp morning surges needs different equalization and media capacity than a steady industrial stream. Get recent lab results. Old data can mislead.
Check the carrier media’s protected surface area, fill ratio, and movement within the tank. Media should circulate without dead zones, while screens must retain it during high flow. Ask how aeration supports both oxygen transfer and mixing; excessive air can raise energy use, while weak mixing leaves media clustered. Inspect access to screens and blowers. Maintenance should be practical.
Compare expected effluent quality with the whole treatment train, including clarification or filtration after the reactor. Confirm how the design handles cold weather, shock loads, and gradual biomass recovery after cleaning. Request operating references with similar wastewater, plus energy and maintenance records—not just design projections. Forecasts are imperfect. A site pilot may reveal a stubborn foaming issue or uneven airflow that calculations miss. Budget for sensors, spare screens, and operator training, then assess performance across changing loads.
Comparing MBBR Systems by Capacity, Performance, and Cost
Best MBBR System for Wastewater Treatment in 2026
Comparing systems starts with the actual wastewater, not a brochure’s maximum flow rate. Check both daily capacity and peak-hour flow, along with incoming BOD, COD, and suspended solids. A compact tank may handle steady municipal flow but struggle when production wastewater arrives in short, concentrated bursts. That matters. Equalization and screening can reduce these shocks, though they add space and operating costs.
Performance depends on more than the amount of plastic media in a tank. Media fill fraction, aeration, mixing, temperature, and pretreatment all affect treatment results. Ask for data from wastewater with similar characteristics, and look for results measured over time—not a single favorable sample. A pilot test helps, but it is not a guarantee; seasonal changes and inconsistent influent can still expose design weaknesses. I would be cautious about comparing removal percentages unless the test conditions match.
Cost comparisons should include blowers, pumps, media replacement, routine maintenance, and energy use. For example, a system with a lower purchase price may need more aeration or operator attention. Request a clear breakdown of capital and expected operating costs, then compare it with your site’s flow pattern and discharge targets. The cheapest option is not always the simplest to run.
Installation, Operation, and Maintenance Requirements
Best MBBR System for Wastewater Treatment in 2026
Installation, Operation, and Maintenance Requirements
An MBBR performs only as reliably as its screens, airflow, and mixing. During installation, confirm carrier-retention screens suit the media and remain accessible for inspection. Check that aeration moves carriers across the tank, including corners. Uneven mixing can leave stagnant zones, even when the water looks active. Commission gradually, recording flow, temperature, dissolved oxygen, and effluent ammonia.
The U.S. EPA’s 2008 Municipal Nutrient Removal Technologies Reference Document describes typical MBBR media fill levels of about 30–70% of reactor volume. Treat this as a design range, not a universal setting. The EPA’s 2010 Nutrient Control Design Manual identifies roughly 2 mg/L dissolved oxygen as a practical nitrification target; actual needs vary with temperature and loading. Check blower pressure and screen headloss routinely. Rising headloss may indicate debris buildup or blocked screens.
Tips: Keep a spare screen panel and a calibrated DO meter onsite. Inspect screens after flow surges, and log adjustments alongside lab results. Small details matter. Visual checks can miss hydraulic short-circuiting, so periodic process reviews are worthwhile.

